Are the Engines in Your Favour?
How to work out whether a stock's earnings engine and its valuation engine are both working for you, using only a screener page, a calculator and seven questions. Worked end to end on Lupin.
A share price is made of two things and people usually only check one. The business earns a profit, and the market decides what to pay for each rupee of it. Move either one and the price moves. Check only one and you have half an answer, and it tends to be the wrong half.
What follows is the whole check, done by hand. No model, no spreadsheet. A screener page, seven questions, three calculations you can do on paper, and one table at the end that turns the question 'is this expensive' into a question you can actually answer.
The example is Lupin in September 2026, chosen because it is awkward. It screens as cheap, its business genuinely improved, and the answer at the end is still not simple. A company that made the worksheet easy would teach you nothing.
Market value always equals profit times the multiple.
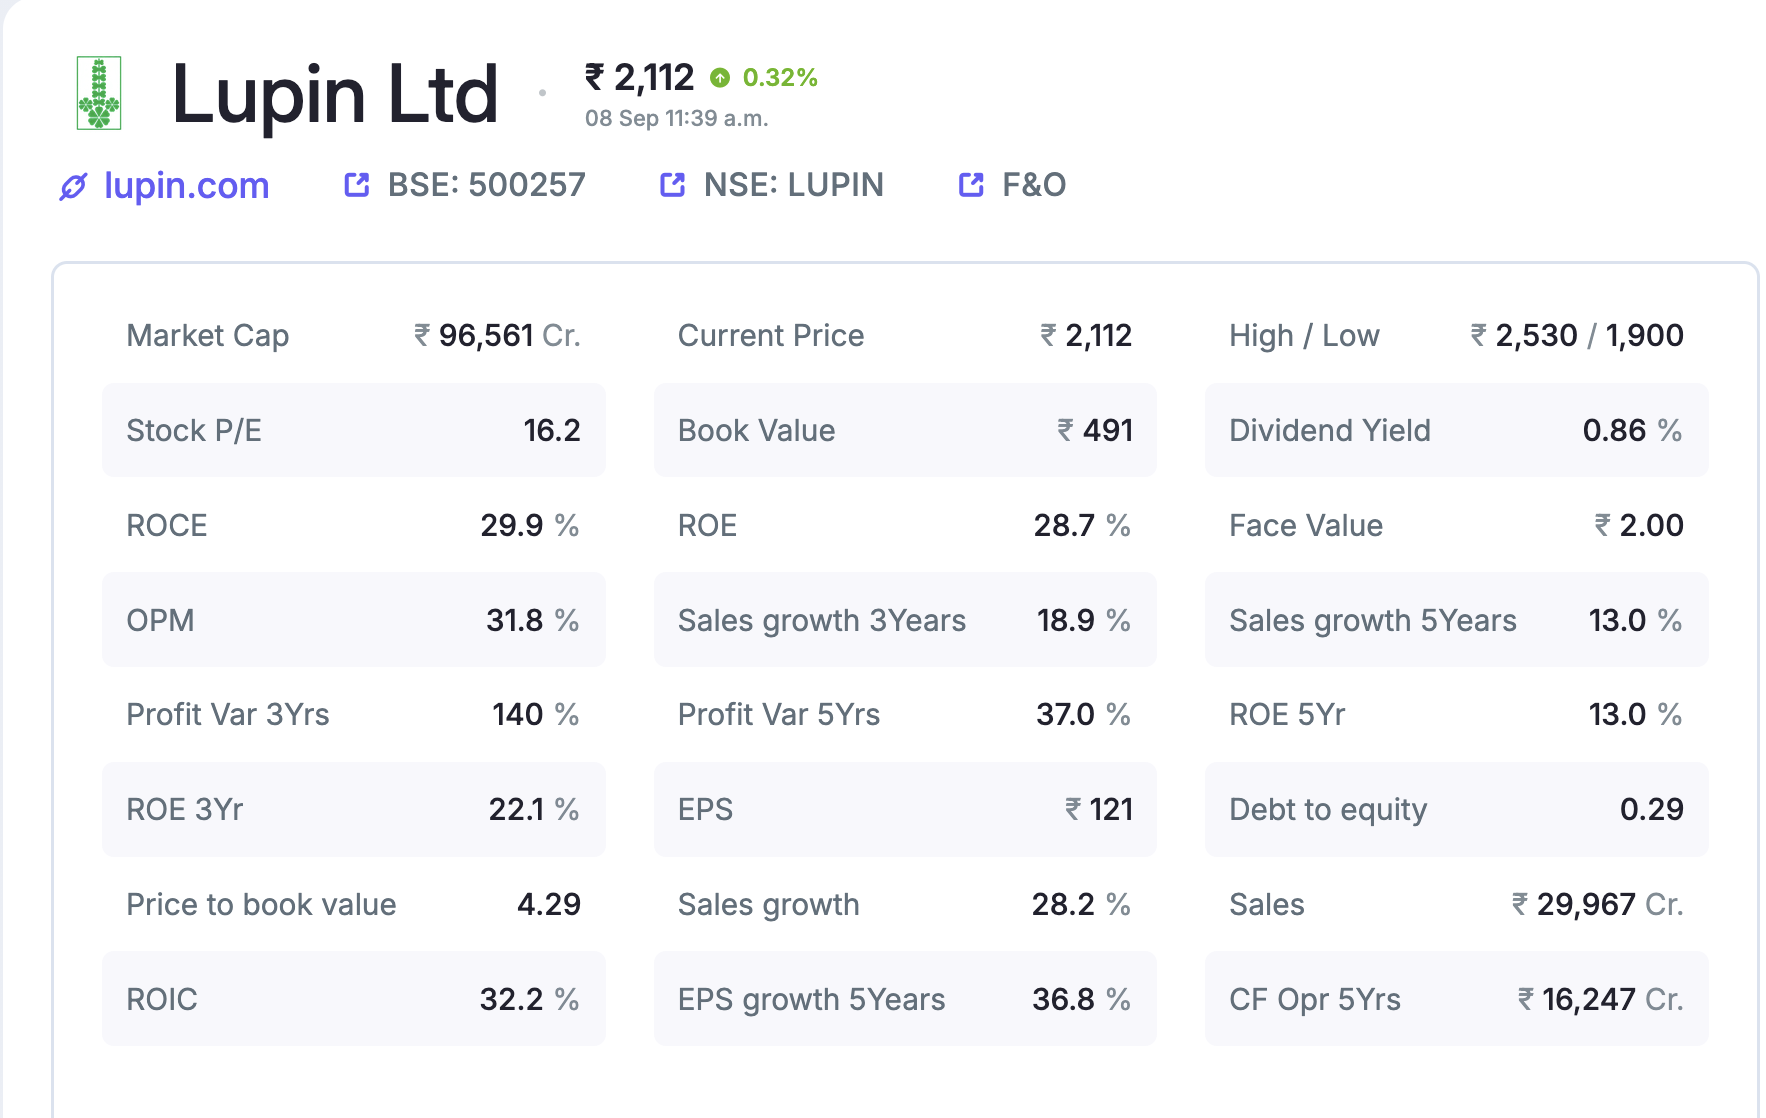
That is not a theory. It is the definition of a PE, rearranged. Lupin earned ₹120.98 a share over the last twelve months, and a share costs ₹2,112. Divide one by the other and you get 17.5. Multiply back and you get the price again. The same identity holds for the company whole: ₹5,551 crore of profit against a market value of ₹96,561 crore.
Everything below is that one line, pushed in different directions. The earnings engine asks what happens to the first number. The valuation engine asks what happens to the second. Both have to be going your way, or at least one has to be going your way hard enough to carry the other.
The worksheet: seven questions
Write these down before you look at anything. The order matters, because a later question can make an earlier answer irrelevant.
| Engine | Question | What a bad answer looks like |
|---|---|---|
| One | Is profit growing, at ten, five and three years and over the last twelve months? | Declining, or growing only in the longest window |
| One | Is the growth cash-backed? Five years of operating cash flow over five years of profit. | Below 50%. The profit is sitting in receivables or inventory |
| One | What is the growth made of? Volume, margin, a one-off, or other income? | Margin has a ceiling. A one-off has none of the qualities you want |
| One | Can you name what produces the next leg, or does it need a tailwind you cannot see? | Nothing specific. The catalyst is 'the sector should do well' |
| Two | What multiple am I actually paying on the earnings this business is likely to produce? | It only looks cheap because the denominator is temporarily inflated |
| Two | Over the last few years, did the price run ahead of the earnings or behind them? | Ahead, for years |
| Two | Did returns on equity rise or fall while that happened? | Fell, while the multiple expanded. That is sentiment, not a re-rating |
What to copy off the page, and in what order
From the ratios box at the top of the screener page: market value, current price, the 52-week high and low, the stock PE, book value, return on capital and return on equity.
From the four compounded tables under the chart, all four rows at ten years, five years, three years and the last twelve months. Sales growth, profit growth, share price growth and return on equity. Two of those rows get skipped by almost everybody, and they are the two that decide engine two.
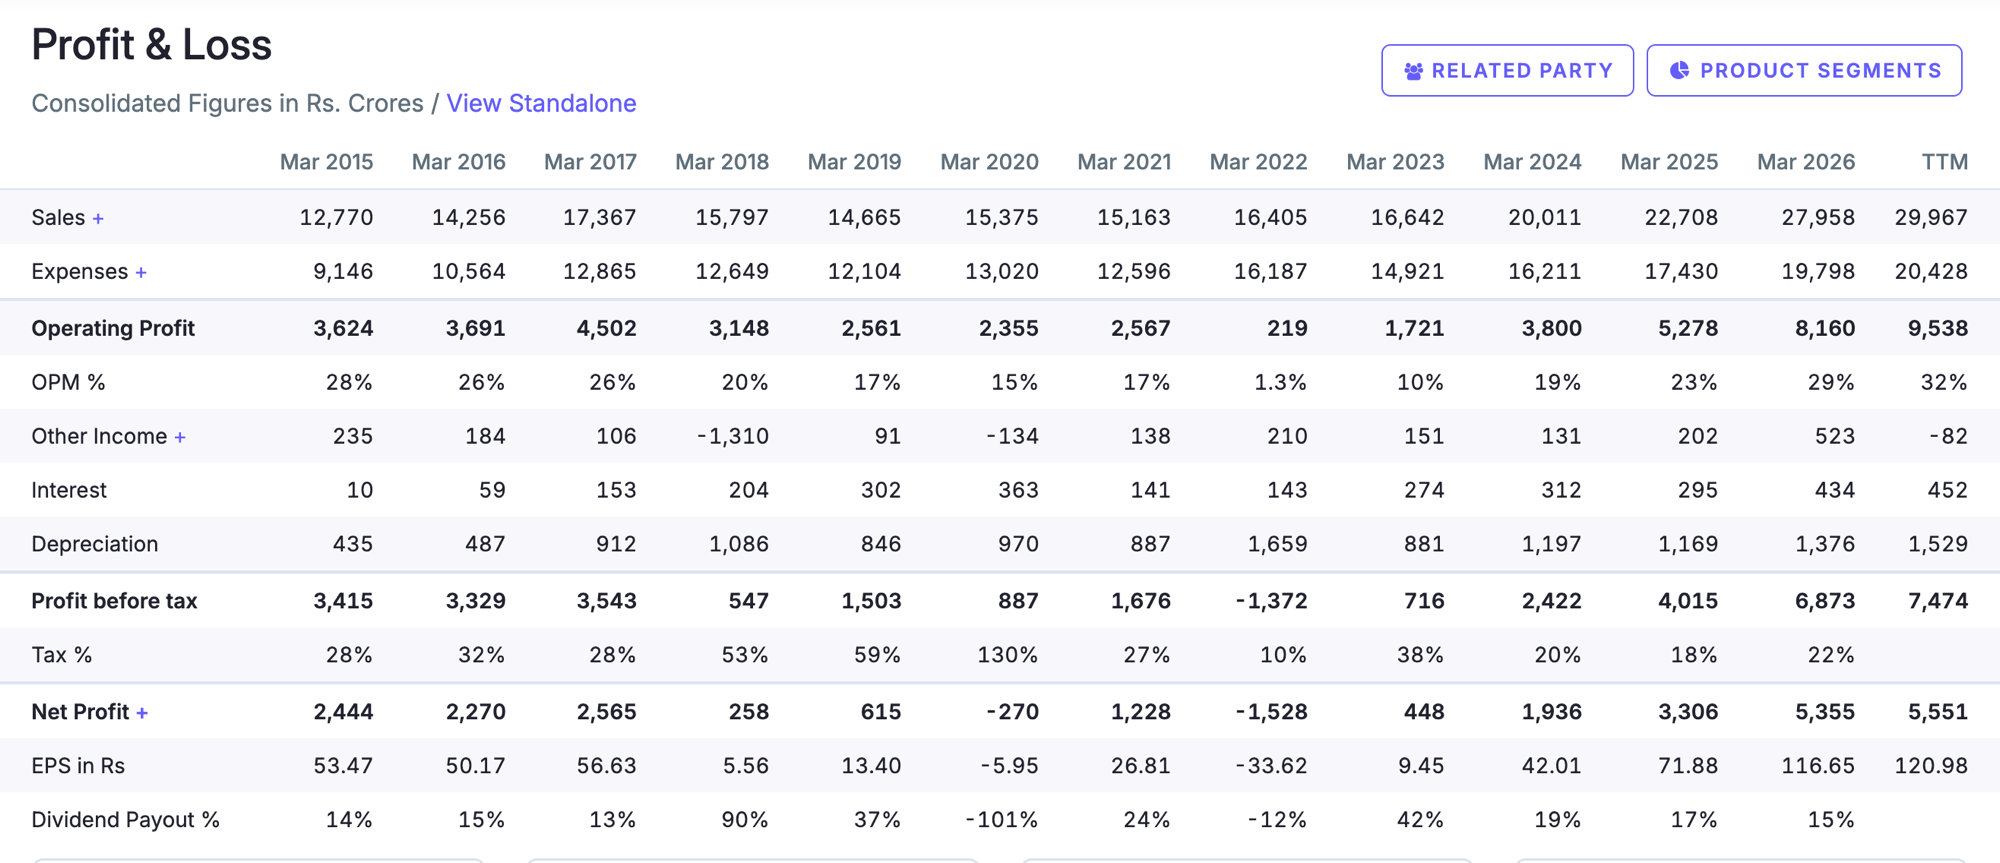
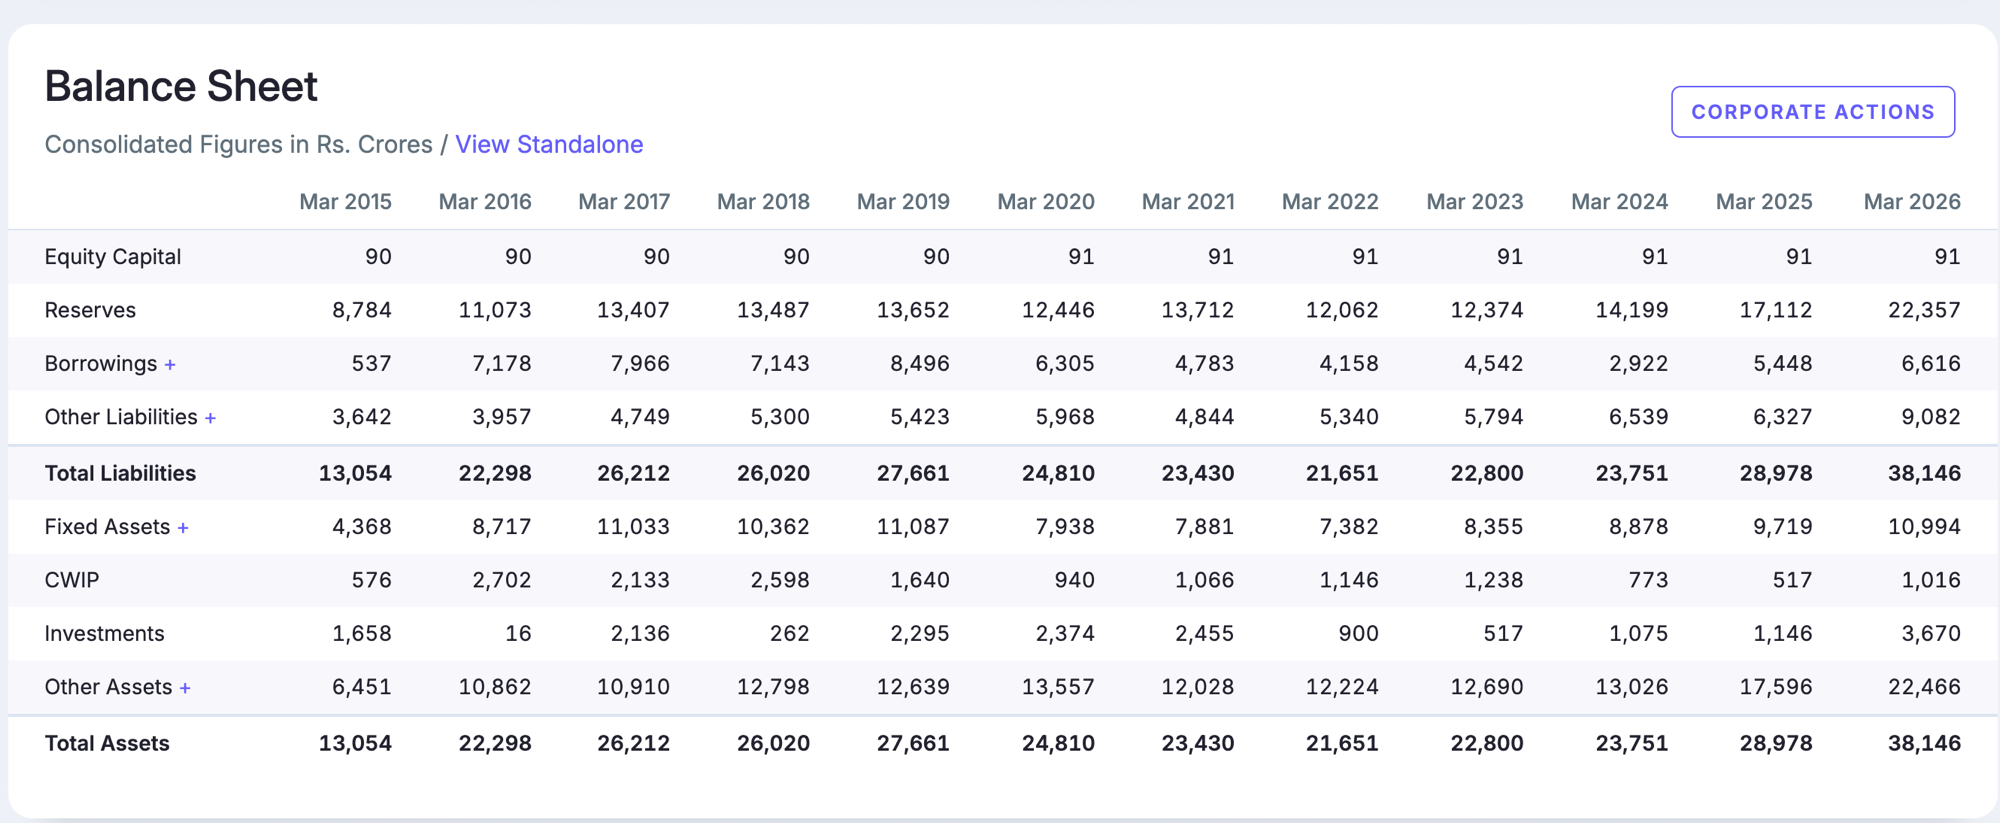
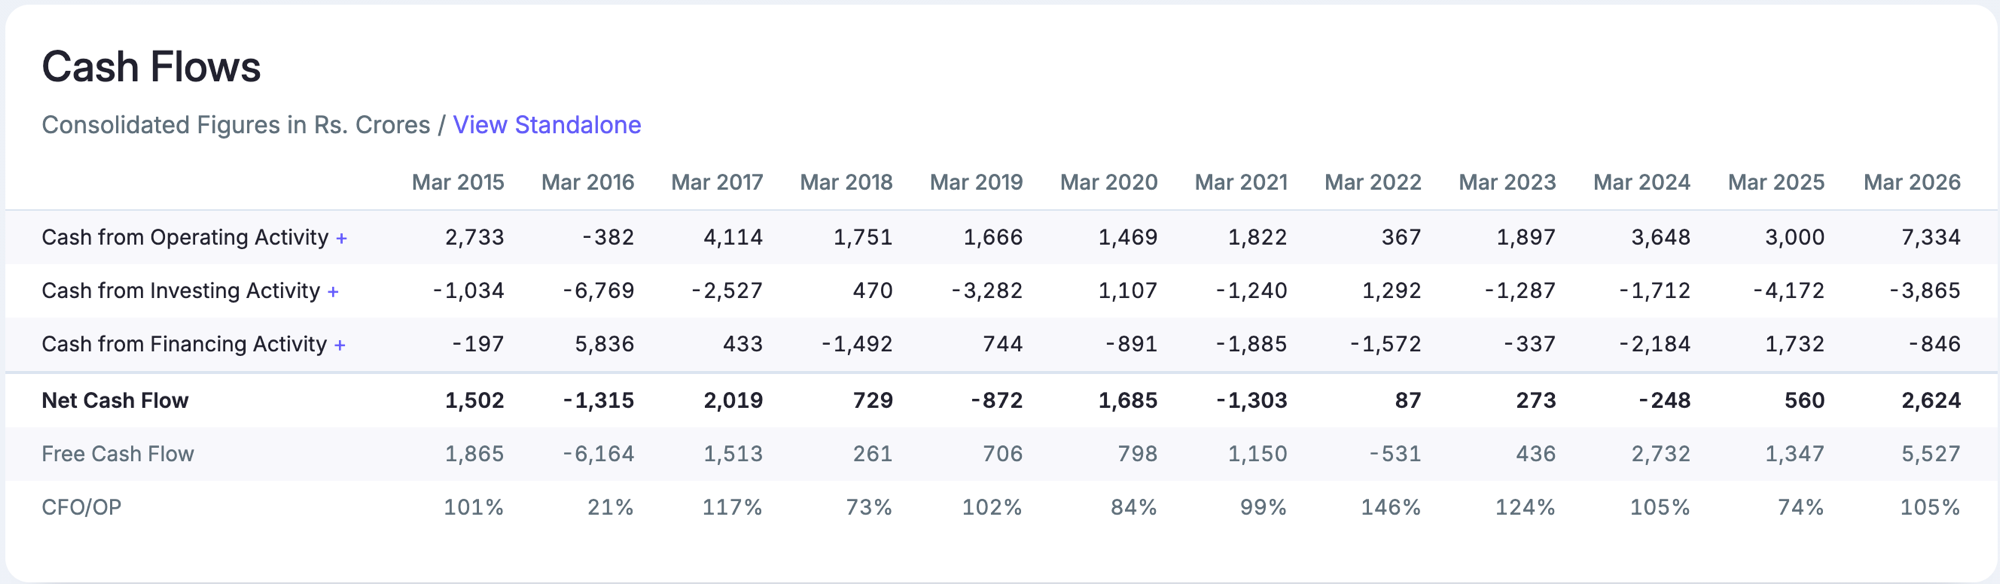
From the yearly profit and loss: sales, operating margin, net profit and earnings per share, for as many years as the page shows. From the quarterly table: the last eight quarters of sales, operating margin, other income and net profit. From the cash flow statement: five years of cash from operating activity. From the balance sheet: borrowings.
That is the whole shopping list. It fits on one sheet of paper, and the three big tables sit behind their own anchors: profit and loss, balance sheet and cash flows.
The block most people skip
This is the compounded growth block from Lupin's page. One catch before reading it: the first three columns are compounded annual rates and the last one is a single period, so do not compare the last column to the others as though it were the same kind of number.
| 10 years | 5 years | 3 years | Last 12 months | |
|---|---|---|---|---|
| Sales growth | 7% | 13% | 19% | 28% |
| Profit growth | 10% | 37% | 140% | 61% |
| Share price growth | 3% | 16% | 23% | 8% |
| Return on equity | 10% | 13% | 22% | 29% |

Reading the block
Sales against profit tells you what happened to margins. If profit compounded faster than sales, each rupee of revenue became worth more. Lupin's profit ran far ahead of sales in every window, so margins expanded, and expanded hard.
Share price against profit tells you what the multiple did. This is the row nobody copies and it is half of engine two. Lupin's profit grew 61% over the last year and the share price grew 8%. The business ran a long way ahead of the price, which means the multiple got smaller.
Return on equity is the referee. It decides whether a multiple move was fair. Rising returns can justify paying more. Falling returns usually make a high multiple harder to defend. Lupin's went 10, 13, 22, 29 across the four windows, so returns improved steadily while the multiple was shrinking. Those two facts are pulling against each other.
Now read the decay across a row. Lupin's profit row goes 10, 37, 140. A jump like that has exactly two explanations and the block cannot tell you which. Either growth genuinely accelerated, or the year the short windows start in was a terrible one, which makes the number arithmetic rather than evidence. The yearly profit and loss table settles it in about thirty seconds, which is why that is a check and not an assumption.
Three calculations, by hand
The reason to write these out as equations is that you can see exactly which figure went where, so when an answer looks strange you know which input to go back and check.
One of the three has a name worth pausing on. Multiple drift is how fast the PE itself changed, per year. The box below builds it from the identity at the top rather than asserting it, because the derivation is short and it tells you what the answer means.
The page prints a multiple. Work it out yourself and see whether the two agree.
The page prints 16.2. Where the page and your own arithmetic disagree by more than a few percent, use yours, and say which one you used.
Six short steps get you from the identity at the top to the formula, and every one of them is a line you could redo yourself.
The prices pair off and so do the profits, because both ratios are measured between the same two dates. That is why nothing else about the company needs to be known. A negative answer means the business grew faster than the price, so the multiple shrank. Five years sets 16% price growth against 37% profit growth, and the last twelve months sets 8% against 61%, so the compression sped up. Check the answer against the levels before trusting it: shrinking 15% a year for five years leaves about 44% of what you started with, and 17.5 divided by 0.44 puts the multiple near 40 back then. Take the other route and you get the same place. Discounting today's ₹2,112 by the 16% price growth puts the share near ₹1,006 five years ago, against FY21 earnings per share of ₹26.81, which is about 37 times.
Reported profit is an accounting number. This tells you how much of it actually turned up as money over five years.
Above 100% means the business generated more operating cash than reported profit across the period. That is encouraging, and it still pays to check what drove the cash, because a one-off release of working capital can lift the ratio for a year or two. Below 50% and you should stop here and find out where the profit went.
Four things that can invalidate all of it
Run these before you trust a single number above.
Corporate actions. A bonus issue, a split, a demerger or a merger breaks the share price growth row and the 52-week high and low, because the history then describes a different company. The button sits on the balance sheet, top right. Lupin's equity capital has been ₹90 to ₹91 crore for twelve straight years, so nothing has been issued and the price row is usable.
A one-off sitting in the base. A big gain in an old year makes recent growth look worse than it was, and a big charge does the reverse. Lupin's December 2025 quarter carried a net exceptional charge of ₹426.6 crore. A charge, not a gain, so reported profit is if anything slightly understated. This one comes back clean.
Other income propping up profit. Compare the other income line with profit before tax in recent quarters. In Lupin's June 2026 quarter it was ₹130 crore against ₹2,017 crore, about 6%. Present, not distorting.
The base year. This is the one that fires. Lupin's three-year profit growth of 140% starts in FY23, when it earned ₹448 crore. The five-year figure of 37% starts in FY21, the year after it lost money. Both describe climbing out of a hole. The ten-year figure of 10% is the one that survives, and the cleanest version of all is that profit was ₹2,565 crore in FY17 and ₹5,355 crore in FY26, which is 8.5% a year across a full cycle.
Calling engine one
Profit is growing and the growth is genuinely cash. Five years of operating cash flow come to ₹16,247 crore against ₹9,517 crore of net profit, a conversion of 171 percent. The cash flow statement also carries screener's own operating-cash-to-operating-profit row, which reads above 100 in seven of the last twelve years. Nothing here is being manufactured.
What the growth is made of is where it gets harder. Two thirds of the increase in operating profit over the last two years came from margin rather than from selling more, and the margin came from a small number of medicines in the United States that briefly had almost no competitor. Generic tolvaptan launched in May 2025 with 180 days as the only copy on the shelf.
And the fourth question, the next leg, is where the worksheet stops being comfortable. Management has guided US sales down for FY27, operating margin down from 33.6% to about 25%, and the tax rate up from 22% to 27 or 28%. The named catalyst points down before it points up.
So engine one reads: real, cash-backed, and not repeatable at anything like its recent rate. Improving business, declining next twelve months. Those are two different answers to two different questions and it is worth holding both.
Calling engine two
Drift is negative in every window, and getting more negative: minus 15% a year over five years, minus 33% over the last one. The multiple has been shrinking the entire time the business was improving.
Now the referee. Return on equity rose across the same period, from 10% over ten years to 29% last year. So this is the mirror image of the usual warning. The usual warning is a multiple expanding while returns fall, which is sentiment. Here the multiple compressed while returns rose.
There are only two readings of that, and the worksheet cannot pick between them. Either the market is wrong and this is a business being priced for a past it has left behind. Or the market does not believe the profit in the denominator will still be there, and the low multiple is a forecast rather than a discount.
This is the point where most people stop and declare the stock cheap.
Neither of those calls is the overvaluation test
A high multiple is not the same thing as overvalued, and a low one is not the same thing as cheap. Asking 'is 17.5 times expensive' has no answer, because it depends entirely on the company.
One question replaces both calls, and this one has an answer:
What growth does this price require, and has this business ever delivered it?
Work backwards from the price. Never forwards from a story.
Working backwards, one step at a time
Start from what you want, not from what the company is worth. Say you want 15% a year for five years. That is roughly doubling your money, and it is a rate you could defend as fair payment for the risk of owning one company rather than an index.
Everything below is that one wish, turned into a demand on the business. It looks like a spreadsheet and it is really four sentences.
So in 2031, if the company is worth ₹1,94,219 crore, you will have earned your 15% a year. That single number is where the exercise starts, and this is how you get it.
Today's market value grown at your 15% for five years. This is the only step where your own wishes appear. From here the arithmetic is indifferent to what you would like to happen.
You now know what the company has to be worth. What you do not know is how that value gets split between the profit it earns and the price the market puts on each rupee of it.
The same line the article opened with, five years further on. You know the left-hand side, because you chose it. You know neither term on the right. Assume one and the other is forced.
The multiple five years out is the one number nobody can look up, so give it a name and then vary it. The exit multiple is whatever the market happens to be paying for each rupee of profit on the day you sell. Assume it, and the profit is forced. If the market still pays 17.5 times in 2031, the company has to be earning ₹11,098 crore for you to get your 15%.
The multiple is just the price the market puts on each rupee of annual profit. At 17.5 times, one rupee of profit is worth ₹17.5 of market value. At 15 times it is worth ₹15. Your target has not moved, because you are the one who chose it, so a lower price per rupee has to be made up with more rupees. It works the way being paid by weight does. If the rate per kilo drops, you carry more kilos to take home the same money. Here that is ₹1,850 crore of extra profit, about 17% more, with nothing about the business having changed. You cannot know the exit multiple in advance, which is exactly why it deserves attention rather than a shrug. Anyone expecting a return from a share has already assumed one, whether they wrote it down or not.
Set that against the ₹5,551 crore it earns today, and you have the growth rate your 15% is quietly asking the business to deliver.
Doubling profit over five years is 14.9% a year, which rounds to 15. Keep the unrounded figure in front of you when you compare it with a record, because the rounding is yours and the record is not. You now have something you can test: not an opinion about whether 17.5 times is expensive, but a claim that this business must compound profit at roughly 15% a year, held against a ten-year record of 10%.
- 01Fix your own hurdle. You want 15% a year for five years. Compound today's market value at that rate and you get the market value the company has to reach for you to have earned it. Nothing about the business has entered yet, only what you want out of it.
- 02Remember that the identity still holds in five years. That future market value will be the profit then, times the multiple then. You know neither. But assume one and the arithmetic hands you the other.
- 03Assume the multiple, and the profit falls out. Do it at several multiples rather than one, because the multiple you exit at is a bet you are making whether you name it or not.
- 04Turn each profit target into a growth rate. Now you are no longer holding an opinion about whether a share is expensive. You are holding a specific claim about how fast this business must grow, and that is something you can check against its record.
The table that comes out of it
Nothing in here is a forecast. It is the price, restated as a demand on the business.
The last column never moves, and that is the point of the table. Every row hands you the same 15% a year, because that is what you asked for at the start. What changes down the rows is how hard the company has to work to produce it. At 20 times the business grows 11.8% a year and you get your 15%. At 12 times it has to grow 23.9% a year for you to get exactly the same 15%. Nothing about the medicines changed between those two rows. Only what the market is willing to pay for a rupee of profit in 2031.
| If the multiple in 2031 is | Profit must be | Which is | So the company must grow at | And you earn |
|---|---|---|---|---|
| 20 times | ₹9,711 crore | 1.75 times today | 11.8% a year | 15% a year |
| 17.5 times, unchanged | ₹11,098 crore | 2.00 times today | 14.9% a year | 15% a year |
| 15 times | ₹12,948 crore | 2.33 times today | 18.5% a year | 15% a year |
| 12 times | ₹16,185 crore | 2.92 times today | 23.9% a year | 15% a year |
Why you run four rows and not one
The row where the multiple stays exactly where it is always looks the most comfortable, and it is the least honest. Holding today's multiple for five years is itself a bet, and usually a large one. The other rows are what happens if that bet loses. They tell you how much cushion you have.
Now put the record next to the requirement. Lupin's ten-year profit growth is 10% a year, and the clean nine-year figure is 8.5%. The price is asking for 11.8% to 23.9% depending on where the multiple lands. The three-year figure of 140% is not available as a defence, because it starts in a year the company nearly lost money.
Now vary the growth, not just the multiple
The last table varied the exit multiple and held the growth rate still. Do it the other way round and something more uncomfortable appears. The compounded block hands you four different growth rates for the same company, and each one is measured from a different starting year, so each one describes a different business.
Here they are, run forward five years from Lupin's trailing profit of ₹5,551 crore, with the multiple held at 17.5 so only the growth is moving.
| Growth window | Rate | Where it starts | Profit in 2031 | You earn |
|---|---|---|---|---|
| Last twelve months | 61% | A year flattered by 180 days of exclusivity | ₹60,048 crore | 61% a year |
| Three years | 140% | FY23, when profit was ₹448 crore | ₹4,42,005 crore | 140% a year |
| Five years | 37% | FY21, the year after a loss | ₹26,790 crore | 37% a year |
| Ten years | 10% | FY16, an ordinary year | ₹8,940 crore | 10% a year |
Turn each rate into a revenue the company has to earn
That table is not yet a test, because a growth rate can be asserted and nothing pushes back. Profit is revenue times margin, so fix the margin and the revenue is forced. Then you have a number that can be checked against a real industry.
Use 13.2%, which is what Lupin's own FY27 guidance implies once you put the guided revenue, margin and tax rate through the profit and loss. Its trailing net margin is 18.5%, so this is already the conservative half of the argument.
Read the last column and the exercise finishes itself. Lupin's revenue took eleven years to go from ₹12,770 crore to ₹29,967 crore, which is 8.1% a year. Only the bottom row is in the same universe, and even that one asks the company to more than double its historical growth rate for five straight years.
| Growth window | Profit in 2031 | Revenue it must earn | Versus today | Revenue growth needed |
|---|---|---|---|---|
| Last twelve months | ₹60,048 crore | ₹4,54,911 crore | 15.2 times | 72% a year |
| Three years | ₹4,42,005 crore | ₹33,48,525 crore | 111.7 times | 157% a year |
| Five years | ₹26,790 crore | ₹2,02,955 crore | 6.8 times | 47% a year |
| Ten years | ₹8,940 crore | ₹67,727 crore | 2.3 times | 18% a year |
One line converts an assumption you cannot argue with into a number you can go and verify.
Done at the ten-year growth rate, the mildest of the four. Even here the company has to reach ₹67,727 crore of revenue by 2031 from ₹29,967 crore today. The Indian pharmaceutical industry as a whole is projected to be about ₹6.89 lakh crore by then. Lupin sells largely abroad so that is a scale reference rather than a market share, but it tells you the size of what is being asked.
Then go and look at the world
You now have a revenue target with a date on it, and that is the first thing in this whole worksheet you can take outside the accounts and check. Four places to look, in this order.
The company's own record. Has it ever grown revenue at this rate, for this long? Lupin's answer is 8.1% a year across eleven years, so 18% would be new behaviour and 47% would be unprecedented. A company that has never done something is not disqualified from doing it, but the burden of proof moves.
Management's own guidance. They know more than you and they are on record. Lupin has guided FY27 US sales down, operating margin down from 33.6% to about 25%, and the tax rate up from 22% to 27 or 28%. Every one of those points the wrong way for every row in the table.
The size of the pool. The Indian pharmaceutical market was about ₹5.20 lakh crore in 2026 and is projected near ₹6.89 lakh crore by 2031, growing at under 6% a year. Any row that needs the company to grow at 47% or 72% is asking it to take share from everyone at once, in an industry that is barely growing.
A named catalyst with a date. Not a theme, a specific thing: a plant coming online, a patent expiring, a product launching with exclusivity, a duty being imposed. Lupin had one, generic tolvaptan with 180 days of exclusivity from May 2025, and it is the reason the trailing number looks the way it does. A catalyst that has already happened is in the base, not in the future.
What the exercise actually settles
Notice what changed. You started by wanting 15% a year from a company that looked fundamentally strong. You did not end up with a forecast, and you did not end up with a verdict on whether 17.5 times is expensive. You ended up holding a specific claim, with a date, that somebody can be wrong about.
That claim is: Lupin must reach roughly ₹67,727 crore of revenue by 2031, on a 13.2% net margin, for you to earn 15% a year with the multiple unchanged. Every part of that is checkable. The revenue is reported quarterly. The margin is guided. The multiple you chose yourself.
And the four rows are not four scenarios of equal weight. Three of them are arithmetic performed on a base year that does not survive inspection, which is the same trap the compounded block sets earlier in this worksheet. The ten-year row is the only one measured from a year Lupin was operating normally, and it is the only one worth carrying forward.
The wrinkle this particular company adds
Everything above used trailing profit of ₹5,551 crore as the starting point. For most companies that is fine. Here it is the single most important assumption in the exercise, and it is probably wrong.
Management has guided FY27 revenue, margin and tax rate. Put their own numbers through the profit and loss: roughly ₹29,000 to ₹30,000 crore of revenue at the guided 25% margin, less depreciation of around ₹1,850 crore and interest of around ₹450 crore, taxed at 27.5%. Read the 25% as the average for the whole year and profit lands near ₹3,700 crore. Read it as the level from here, with the June quarter keeping the 31.4% it actually earned, and it lands near ₹4,100 crore. Call it ₹3,900 crore. That is arithmetic on their guidance, not a forecast, and every assumption sits in those two sentences so you can change them.
On ₹3,900 crore, the same ₹96,561 crore market value is 24.8 times earnings, not 17.5. The cheapest-looking number on the page was measuring a year that is ending.
Rerun step four with that base and the requirement changes completely. Holding today's multiple needs 30% a year rather than 15%. Even a re-rating up to 20 times needs 26% a year. The multiple was never the thing to argue about. The number underneath it was.
The asymmetry, which is what decides it
Last table. Pick a profit growth rate, pick an exit multiple, and read off what you earn per year over five years. Dividends would add roughly 0.9% a year to every cell.
| If profit grows | Profit in 2031 | Exit 12x | Exit 15x | Exit 17.5x |
|---|---|---|---|---|
| 20% a year | ₹13,813 cr | +11.4% | +16.5% | +20.1% |
| 15% a year | ₹11,165 cr | +6.8% | +11.6% | +15.1% |
| 10% a year | ₹8,940 cr | +2.1% | +6.8% | +10.1% |
| Flat | ₹5,551 cr | -7.2% | -2.9% | +0.1% |
Reading the asymmetry
Move across any row and the return roughly doubles. Move down any column and it roughly doubles too. Neither engine dominates, which is what it looks like when a thesis needs both of them.
Look at what the low starting multiple buys you. The worst cell is minus 7% a year, not minus 40%. A compressed multiple is a floor, not an engine.
There is no cell on this table where the shareholder earns 15% a year simply because the stock looked cheap. The business still has to do the work.
Which traps fired
The same worksheet run on any company will trip some of these. Keeping the list next to you is most of the discipline.
| Trap | Fired here? |
|---|---|
| Growth measured off a loss-making base year | Yes. The three and five year figures both start in a hole |
| The page's own PE is wrong | Yes. 16.2 shown against 17.5 computed |
| A margin that jumped more than five points in a year | Yes. Verify the cause before capitalising it |
| Peak earnings dressed as a low multiple | Yes. The reason the exercise turns |
| Corporate action breaking the price history | No |
| Other income propping up profit | No. About 6% of profit before tax |
| Cash conversion below 50% | No. 171% over five years |
| A lender, where cash conversion and debt ratios do not apply | No |
The two calls, together
Engine one is amber. The earnings engine is materially repaired and the cash supports the quality of those earnings, and the next twelve months go backwards on management's own guidance.
Engine two is amber too, for a reason the raw number hides. The multiple compressed while returns rose, which is a real cushion and means you are not paying for the good years. But on the profit this year will actually produce, 24.8 times is ordinary. Cheap against a screen is not the same thing as a valuation that helps your return.
Every step of that is a number you copied or worked out yourself, so when the next quarter lands you know exactly which line to check.
That is the check run on a company that looks cheap. Part two runs the same three calculations the other way round, starting from a company you already rate and a return you want, on a business whose price has already priced the good news.
What to ignore, what to watch
- The PE printed on the page. Compute your own and use that.
- Any compounded growth rate until you have looked at the year it starts in.
- A return on equity quoted on a year of unusually high profit. The same number is flattering both ratios at once.
- The share price growth row in the compounded block. It is half of engine two and almost nobody copies it.
- The direction of return on equity next to the direction of the multiple. Those two together separate a re-rating from a mood.
- The gap between what the price requires and what the record shows. That gap is the decision.
The seven questions, to keep
Nothing here is about pharma, or about this company. Take them to whatever you look at next. The reverse valuation is not one of the seven, because it comes after them and answers a different question.
- Is profit growing, and does the growth survive a look at the year it is measured from?
- Did the profit arrive as cash? Five years of operating cash flow over five years of profit.
- What is the growth made of, and does that ingredient have a ceiling?
- Can I name what produces the next leg, or am I extrapolating the last one?
- What multiple am I actually paying, once I use the earnings the business is likely to produce rather than the ones it has just reported?
- Did the price run ahead of the earnings or behind them, and by how much a year?
- Did returns rise or fall while that happened, and does the direction make the multiple easier or harder to defend?
- What revenue does each of those growth rates require by the exit year, and has this company or its industry ever produced that?
History rhymes
| This event | Rhymes with | Same mental model |
|---|---|---|
| A multiple that shrank while profit grew | Vinati Organics, where the multiple rose as earnings fell | The multiple carries a claim about the earnings, not just a price for them. |
| A five-year growth rate measured from a loss-making year | Every recovery story whose compounding starts at the bottom of the hole | Choose the base year and you have chosen the conclusion. |
Run the worksheet yourself. Take a company whose profit per unit is at a ten-year high because a large competitor was offline for most of last year. It trades at 12 times trailing earnings, the cheapest in its sector, on a 24% return on capital. The competitor restarts next quarter.
- Which of the seven questions does this company fail, and at which step do you find out?
- What is the multiple drift likely to look like, and what will the referee say about it?
- Before running the reverse valuation, what do you have to do to the starting profit, and why?
- At an exit of 12 times, what growth would a 15% return require, and is that plausible once the competitor is back?
Think it through first. Then check your reasoning.
- It fails question three. The growth is made of a competitor's outage, which is neither volume nor margin nor anything with a future in it. You find that out at step three of the worksheet, before touching valuation.
- Drift is probably negative, and the referee is probably rising, exactly as in the worked example. Both look encouraging and both are being computed off a profit that is about to fall.
- Normalise the starting profit first, the way the guided FY27 number was used above. Reverse valuation off a peak base always understates what the price is asking for, and the size of that understatement is the finding, not a footnote.
- Whatever the answer is, compute it off the normalised profit and not the peak. The point is that the multiple was never the argument. The number underneath it was.
Follow the threads
Each bottleneck is a thread you can pull: the sector where it bites, the companies exposed to it, and the case studies that lived it.
Sources
- Screener: Lupin consolidated financials ↗
- Lupin Q1 FY2027 results (press release, 6 August 2026) ↗
- Lupin FY2026 and Q4 FY2026 results (press release) ↗
- Lupin Q3 FY2026 results (the exceptional charge) ↗
- Lupin launches tolvaptan tablets in the US with 180-day exclusivity ↗
- Lupin Q1 FY27 slides: FY27 guidance on US revenue, margin and tax rate ↗
- Indian pharmaceutical market size and 2031 projection (Mordor Intelligence) ↗
The check needs no tools beyond a screener page and a calculator. The seven questions establish whether the business is growing, whether the growth is cash, what it is made of and whether there is a next leg. The three calculations establish what the multiple really is, which way it has drifted and whether returns earned that drift. Four checks can invalidate all of it, and on this company one of them did. Then you set both verdicts aside and work backwards from the price to the growth rate it demands, because that is the only version of the question with an answer. Do it once by hand and the screen stops being able to fool you, because you will know which number every ratio is standing on.
Stop asking whether the multiple is high. Ask what growth the price requires, then go and look at whether this business has ever done it.