Why does a stock get more expensive when its earnings fall?
A stock's price is its earnings per share times the multiple (the P/E) investors pay for them, so when the price rises while earnings fall, the multiple did all the work. It happens because the two numbers face opposite directions in time: reported earnings are a photograph of a year that has ended, while the price is a bet on the years ahead. When the market looks past a temporarily damaged year to a recovery it can already see, it pays a higher multiple on lower earnings. Vinati Organics is the example: FY21 EPS fell about 19% to ₹26.2 while the stock made new highs.
Here is a paradox that trips up almost every beginner. A company's profit falls. Its earnings per share drops nearly a fifth. And over the very same stretch, the stock does not fall. It recovers, and then climbs to new highs. On paper the business got worse, yet the market decided it was worth more per rupee of profit than before.
This is not a glitch, and it is not the market being irrational. It is one of the most useful ideas in valuation, and once you see the machinery behind it you will never read a P/E ratio the same way again. We will build the whole thing from one equation, using a real Indian company, Vinati Organics, as the worked example.
The paradox, stated plainly
Vinati Organics makes speciality chemicals. In the year to March 2020 (FY20) it earned about ₹32.5 of profit per share. The next year, FY21, its plants were shut for weeks in the COVID lockdown and demand for one of its key products softened. Earnings per share fell to about ₹26.2, a drop of roughly 19%.1
A beginner would expect the stock to fall with the profit. It did the opposite. After the March 2020 crash it recovered and went on to new highs. So the market was paying a higher price relative to the earnings the business had just reported. How?
The answer is that the price of a stock is not the earnings. It is the earnings multiplied by something else. And that something else moved far more than the earnings did.
The whole thing is one equation
We can take any stock price and split it into two numbers: the earnings the company has already reported per share, and the multiple investors are paying for those earnings. Price equals EPS times P/E.
That multiple is the price-to-earnings ratio, the P/E. It is simply how many rupees investors pay today for one rupee of the company's trailing earnings. A P/E of 30 means investors are paying ₹30 for every ₹1 of those trailing earnings.
One caveat, and it matters. This is an identity, not a theory of how the market sets prices. The P/E is defined using the price, so we are not claiming EPS and P/E cause the price. We are only decomposing it. The usefulness is exactly that: it lets us separate how much of a move came from earnings changing and how much came from the valuation changing. Read it slowly, because everything else here is a consequence of it: if the price moves, one of the two on the right moved, and it is worth knowing which.
So a stock moves for two separate reasons
Because price is earnings times a multiple, a rising stock can be doing one of two very different things. Either the earnings grew, or the multiple people pay for those earnings grew. Usually it is some of both.
This gives you a framework you can point at any stock, ever, and it is exact, not a rule of thumb. The ratio of the new price to the old is the ratio of the new EPS to the old, times the ratio of the new P/E to the old: P1/P0 = (EPS1/EPS0) times (PE1/PE0). In plain words, the change in your stock price is earnings growth combined with multiple expansion or contraction. So if a company grows profit 50% and the market also pays a 50% richer multiple, you do not make 50%, you make 125%, because 1.5 times 1.5, minus 1, is 125%. And if profit grows 50% while the multiple halves, you make almost nothing. The business did well and you still went nowhere.
This is why two investors can look at the same wonderful company and one triples his money while the other loses. They did not disagree about the business. They paid different multiples going in, and the multiple is half the engine.
- Of the return this stock gave, how much came from earnings growing?
- And how much came only from the market agreeing to pay a higher multiple?
Why the two can pull in opposite directions: the time mismatch
Now the crucial part. Why would the multiple rise exactly when earnings fall? Because the two numbers are looking in opposite directions in time.
Reported EPS is backward-looking. It is a photograph of a year that has already ended. The FY21 EPS is a fact about the past, and COVID is baked into it forever.
The price is forward-looking. Nobody buys a share for the profit the company made last year. They buy it for the stream of profits it will make in all the years ahead. The market can see a recovery coming months, sometimes years, before that recovery ever shows up in a reported number.
So in FY21 the market was looking past a temporarily damaged year. It saw a chemicals business with new capacity coming on and demand returning, and priced the future it expected, not the dented present it was handed. Earnings looked backward at the damage. Price looked forward past it. The gap between those two views is the expanding multiple.
Vinati Organics: when earnings fall, but the multiple rises
Put the pieces together on the real company. FY21 was Vinati's weak year: plants shut in the lockdown, softer demand, EPS down about 19% to ₹26.2. That is the denominator of the P/E falling.
Meanwhile the price, after crashing with the whole market in March 2020, recovered and pushed to new highs. That is the numerator rising. By the identity, if the price is up and EPS is down, the P/E must have risen by even more than the price did. The P/E expanded from both ends at once.
And the recovery the market was pricing eventually arrived. Earnings snapped back the very next year: FY22 EPS returned to about ₹33.7, and FY23 rose further to about ₹40.8, comfortably past the pre-COVID level.2 The investors paying up in FY21 were, it turned out, paying for a recovery that arrived.
Two kinds of P/E expansion, and why the difference is everything
A rising P/E is not one thing. It is two things that look identical on a screener and mean opposite things.
The first is price-led. The price rises faster than earnings, so the market is paying more for each rupee of earnings. This is a real re-rating: a change of opinion about the future. It might be right or wrong, but the market is now willing to pay more for the same rupee of earnings.
The second is earnings-led, and it is a trap for the unwary. Earnings fall faster than the price, so the P/E rises mechanically. Nobody re-rated anything. The denominator just shrank. A stock can look more and more 'expensive' on trailing P/E while the market is actually getting more worried about it, not less.
Vinati in FY21 had both working the same way: the price rose and earnings fell, so the multiple was lifted from the top and the bottom at once. But you must always ask which term is moving, because the same number, a higher P/E, can mean 'the market loves this' or merely 'last year was bad'.
- Price rises, EPS roughly flat
- The market now pays more for the same rupee of earnings
- This is a genuine re-rating: a change of opinion
- It is a bet on the future, and it can be right or wrong
- Price roughly flat, EPS falls
- The multiple rises on its own, mechanically
- Nobody re-rated anything: the denominator just shrank
- A cheap-looking business can get "expensive" while doing nothing
The deeper cut: three engines, not one
Most people are taught a single sentence: a P/E rises when the market expects growth. It is not wrong, but it hides the most useful distinction in valuation. There are really three separate things at work here, and it pays to keep them in two boxes, not one.
Two of them are engines of your return. Earnings growth: the company genuinely earns more. And multiple expansion or contraction: the market chooses to pay more, or less, for each rupee of earnings, a real re-rating. Those two, multiplied together, are your entire return, exactly as the identity above showed.
The third is different, and it is the one that fools people. Call it denominator distortion: earnings fall, so the trailing P/E rises all by itself. Notice this one moves no share price at all. If EPS drops from ₹30 to ₹20 while the price sits still at ₹1,000, the P/E jumps from about 33 to 50 and the stock has not moved a rupee. It is not an engine of return; it is a way the reported multiple can mislead you.
That is the point most beginners never reach: a rising P/E does not necessarily mean investors became more optimistic. Sometimes the multiple rises simply because the denominator shrank. When you see a P/E move on any screener, the useful question is not 'is this expensive?' but 'which of the three just fired: real earnings, the market's valuation, or only the denominator?'
What a P/E ratio actually prices
The stock price reflects the market's assessment of the company's future, while the P/E only tells you how large that price is relative to the earnings already reported. So a high P/E on a depressed earnings year can be the market saying that it does not believe the depressed year represents the company's true earnings power.
Those are the terms to keep: when the multiple rises it is a re-rating (or multiple expansion); when it falls it is a de-rating (or multiple contraction). And the return you finally pocket is earnings growth and the re-rating, multiplied together.
The honest other side
None of this says a falling earnings number is good news, or that a rising multiple is a signal to buy. It is not. A rising P/E on falling earnings is the market placing a bet that the future is brighter than the reported present. Vinati's bet paid off. Plenty do not.
When the recovery the price was counting on fails to arrive, the same machinery runs in reverse. Earnings stay weak, the market loses faith, and the multiple contracts. Now both terms fall together and the stock drops hard, because it was carrying a hopeful multiple on top of weak earnings. That is de-rating, and it is exactly as brutal as re-rating is kind.
So the useful skill is not spotting that a multiple expanded. It is judging whether the future the expanded multiple is paying for is actually likely to show up. That judgement is the whole game, and this framework only tells you where to point it, not what the answer is.
BLS International: when earnings rise, but the multiple falls
Everything so far has run in one direction: earnings fell and the multiple rose. Turn the whole thing over and you get the case that confuses beginners just as much. The earnings climb, year after year, and the multiple falls anyway. The business is visibly getting better, but the market is paying progressively less for each rupee of profit. Same identity, opposite term moving.
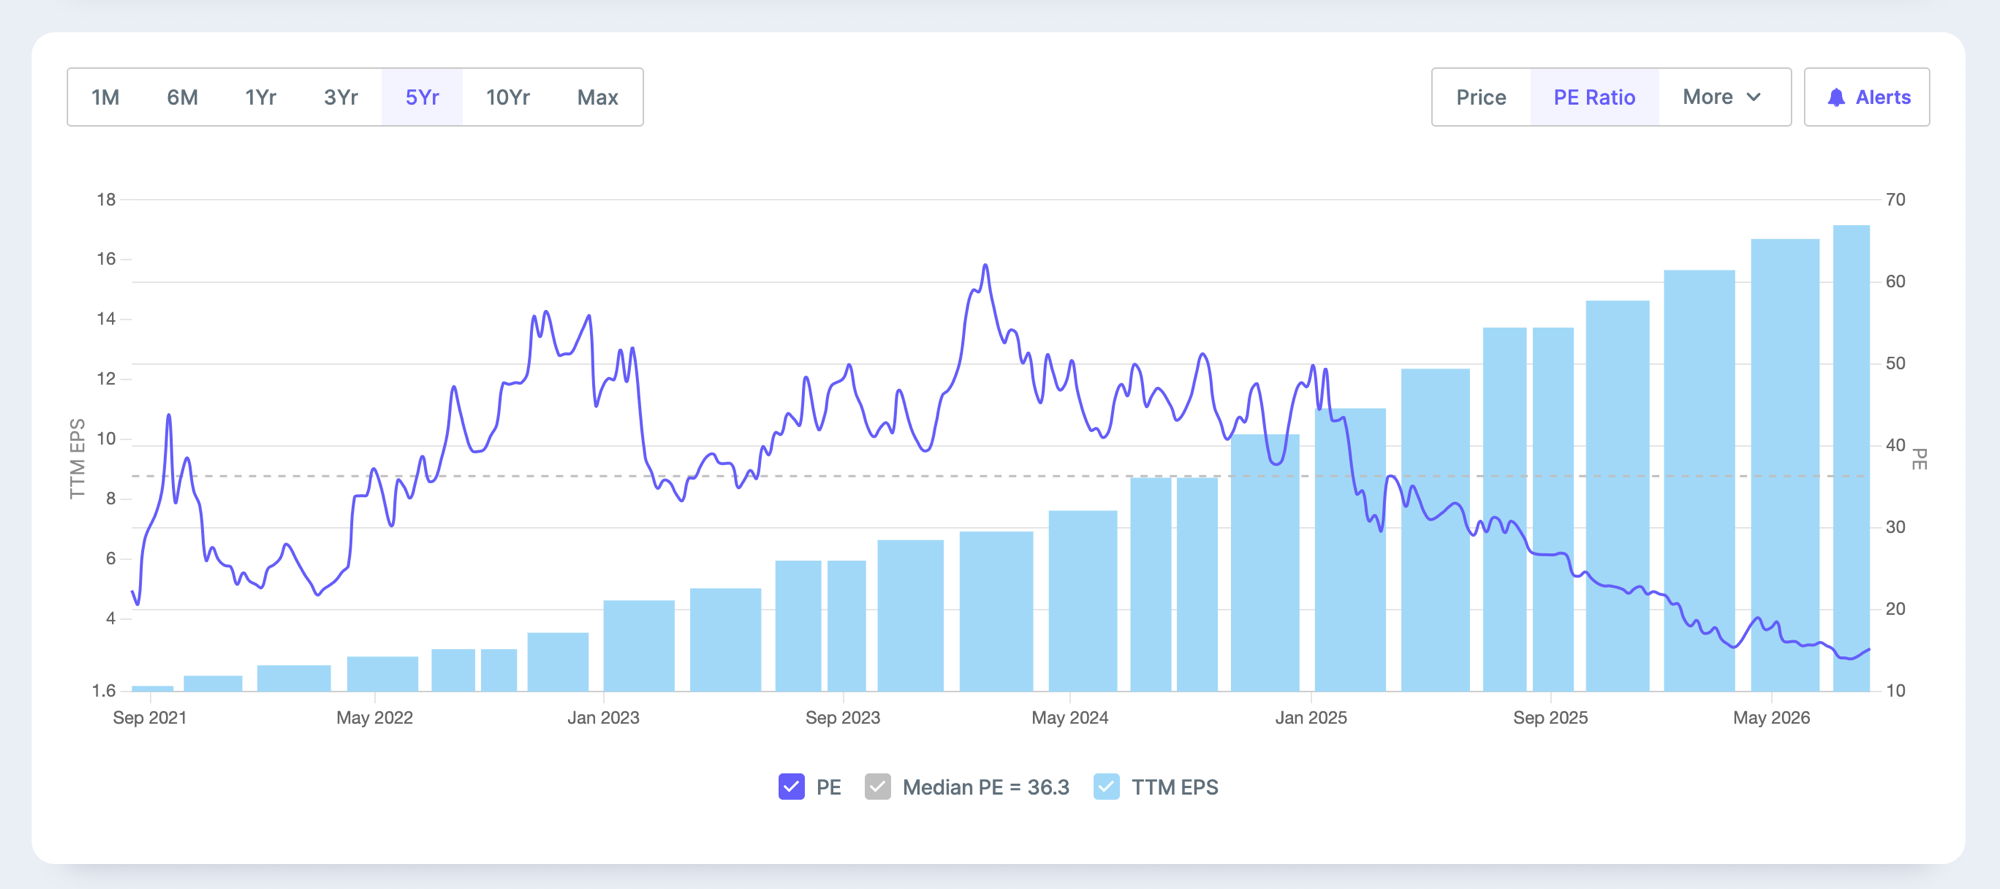
The clean Indian example is BLS International, the visa-outsourcing company. Look at the chart. The pale bars are trailing earnings per share and they march almost straight up, from under ₹2 to about ₹17 over the window. The purple P/E line does the reverse: it starts in the 40s, drifts down through its own median of 36.3, and ends near 14. Earnings did nothing but rise. The multiple did nothing but fall. The two fought each other the entire way.
The exact figures let us split the move directly, no CAGR arithmetic needed. Reported EPS went from about ₹1.22 in FY21 to ₹16.68 in FY26, so earnings grew about 13.7 times.3 Over the same window the share price grew only about 7 times (a compounding of roughly 48% a year). By the identity, price equals EPS times P/E, so the whole gap between those two must be the multiple. The chart bears that out: the P/E falls from roughly 30 times earnings to roughly 15 (chart-read, approximate), about a halving. And it ties out: 13.7 times a half is about 7. So the earnings did the heavy lifting, the shrinking multiple handed part of it back, and what was left was still an exceptional return, just well short of what the earnings growth alone would have suggested.
Why would the market pay less for each rupee even as earnings pile up? Because the price is a bet on the future, and the market's view of that future can change even while reported earnings keep improving. In BLS's case, concerns about government-contract concentration, the company's move into lower-margin digital and loan-distribution businesses, and more recently the October 2025 MEA debarment (set aside by the Delhi High Court that December) all gave investors reasons to reassess what those future earnings were worth. These are possible explanations for the de-rating, not proof that any one of them caused it. The multiple spans years; most of these worries do not, so treat them as candidates, not a verdict.
This is a de-rating, the same machinery as Vinati but running the other way, and it carries the opposite lesson. A falling P/E does not mean the business is failing, exactly as a rising P/E did not mean it was thriving. Sometimes the multiple falls simply because the market has decided the future is less bright, or less certain, than the earnings trend alone would imply. Whether it is right is the whole question. If BLS holds its margins, a compressed multiple on a compounding business is the kind of setup that can re-rate back up. If the mix keeps thinning the profit, the low multiple was the market seeing it early. The framework only tells you the multiple did the work; it does not tell you who is right.
Two companies, one equation, opposite outcomes
Set the two cases side by side, because they are the same equation viewed from opposite ends. At Vinati, EPS fell while the P/E rose: the market looked past a temporarily weak year to a recovery it could already see. At BLS, EPS rose while the P/E fell: the business kept improving, but the market became willing to pay less for each rupee of that improving profit. In both, the business and the valuation were moving in opposite directions, and the stock did something a beginner would call impossible.
So the lesson is not only the one you started with, do not read a P/E in isolation. It is also its twin: do not read earnings growth in isolation either. Great earnings growth stacked under a contracting multiple can leave you with a mediocre return. Falling earnings under an expanding multiple, as Vinati showed, can leave you with a surprisingly strong one. The two levers are separate, and either can quietly cancel the other.
That is the whole case study in one line. Your return is earnings growth multiplied by the change in the valuation the market puts on those earnings. Watch both. A wonderful business bought at a multiple that then contracts for years is how you can be completely right about the company and still disappointed by the stock.
- EPS: fell (down about 19%)
- P/E: rose sharply, from both ends
- What happened: re-rating plus a shrinking denominator
- Result: the price outran the earnings
- EPS: rose (about 13.7 times over five years)
- P/E: fell, roughly halving
- What happened: strong earnings growth against a de-rating
- Result: the earnings outran the price
Using this yourself
Here is the habit to carry away, and it works on any stock screener. A screener only knows today's number. It shows you a P/E, and sometimes that the P/E has risen, but it cannot tell you why it rose. It cannot see the company's own history. So it can never, on its own, tell a genuine re-rating apart from a denominator that simply shrank.
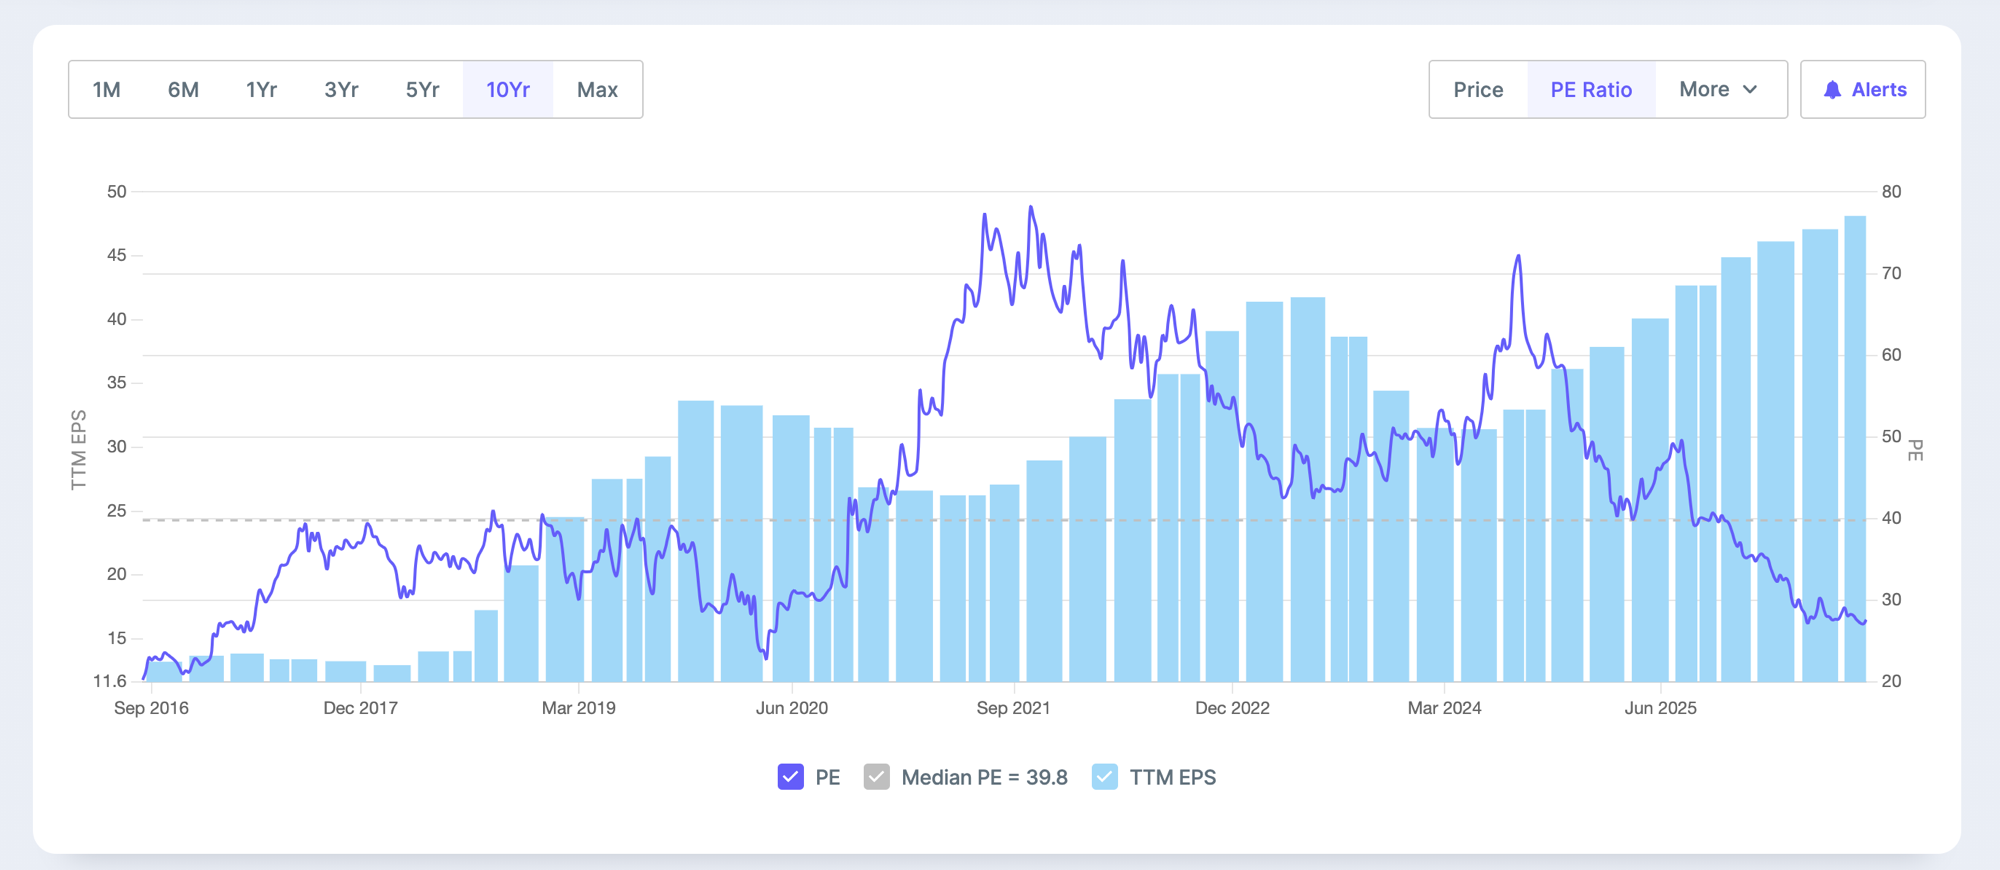
That is what the chart in this piece is for. Pull up any company's P/E against its own long-run median, with its earnings alongside, and the answer becomes visible in one look. Is the multiple sitting above its own history while earnings hold steady or rise? That may indicate a price-led re-rating. Is the P/E high only because the earnings bars dipped? That is the trap, the multiple inflating on a falling denominator while nothing hopeful has actually happened.
Two cautions before you trust what you see. First, mismatched clocks: comparing a one-year price move against multi-year earnings growth can make an ordinary year look like a re-rating, so line up the same period on both sides. Second, cyclicals: in a business whose profits swing with a commodity or a demand cycle, a high trailing P/E often just means earnings are near a low, not that the market has fallen in love. In those, a low P/E on peak earnings can be the more dangerous number.
None of this tells you what to buy. It tells you which question you are actually answering. Not 'is this P/E high?', but 'which engine moved it, and do I believe the future it is paying for?'
- Narrow with the screener, but never trust it to explain a P/E: it cannot see the past.
- Confirm on the P/E-vs-median chart: multiple above its history with earnings holding is optimism; a P/E up only because earnings fell is the trap.
The numbers behind the paradox
The point is the shape, not the decimals: earnings dipped in FY21 and recovered strongly after, while the price never waited for the dip to pass. That gap is the expanding multiple.
Questions people ask
- How can a share price rise while earnings fall?
- Because price equals earnings times a multiple, and the multiple can rise faster than earnings fall. Reported earnings look backward at a year already finished; the price looks forward at the profits to come. In FY21 Vinati Organics' plants were shut for weeks in the COVID lockdown and EPS fell about 19% to ₹26.2, yet after the March 2020 crash the stock recovered to new highs. The market was pricing the recovery it expected, not the dented year it had just been handed.
- What does a P/E ratio actually measure?
- It is how many rupees investors pay today for one rupee of a company's trailing earnings, so a P/E of 30 means ₹30 paid for ₹1 of past profit. The key mismatch is that the price reflects the market's view of future earnings, while the P/E measures that price against earnings already reported. So a high P/E on a depressed year can simply be the market saying it does not believe that weak year represents the company's true earning power.
- Does a rising P/E always mean the market turned more optimistic?
- No, and this is the trap. A P/E can rise two ways. Price-led, where the price outpaces earnings in a genuine re-rating, a real change of opinion about the future. Or earnings-led, where earnings fall faster than the price, so the multiple rises mechanically and nobody re-rated anything. If EPS drops from ₹30 to ₹20 while the price sits at ₹1,000, the P/E jumps from about 33 to 50 and the stock has not moved a rupee. Always ask which term actually moved.
- Did the market's bet on Vinati pay off?
- This time, yes. The recovery the FY21 price was paying for arrived: EPS snapped back to about ₹33.7 in FY22 and ₹40.8 in FY23, comfortably past the pre-COVID level, so the investors paying up were paying for a recovery that showed up. But a rising multiple on falling earnings is only a bet that the future is brighter than the reported present, and plenty of such bets fail. When the expected recovery does not arrive, earnings and the multiple fall together and the stock drops hard.
- Can earnings rise while a stock's multiple falls?
- Yes, and BLS International shows the mirror image. Its EPS grew about 13.7 times, from ₹1.22 in FY21 to ₹16.68 in FY26, yet the share rose only about 7 times, because the P/E roughly halved from around 30 to 15. The market kept paying less for each rupee of a visibly rising profit, on worries such as government-contract concentration and a shift into lower-margin businesses. Great earnings growth stacked under a contracting multiple can still leave you with only a mediocre return.
- How do you tell a real re-rating from a shrinking denominator?
- Pull up a company's P/E against its own long-run median, with its earnings alongside. If the multiple sits above its history while earnings hold or rise, that may be a genuine price-led re-rating; if the P/E is high only because the earnings bars dipped, that is the trap, the multiple inflating on a falling denominator while nothing hopeful happened. Two cautions: line up the same time period on both sides, and remember a cyclical's high trailing P/E often just means earnings are near a low.
Sources
How it unfolded5 moments
- 26 Mar 2020Vinati suspends plant operations as the national COVID lockdown begins; the whole market has already crashed.
- 20 Apr 2020Operations resume, but the FY21 year will carry the damage of the shutdown and softer demand.
- Through FY21Reported EPS falls about 19% to ₹26.2, even as the share price recovers the crash and pushes to new highs. The trailing P/E expands from both ends.
- FY22EPS returns to about ₹33.7, back above the pre-COVID level: the recovery the price had bet on arrives.
- FY23EPS rises further to about ₹40.8, confirming FY21 was a dip, not the true earnings power.
When a P/E changes, ask which of three engines moved it: earnings grew, the market paid a higher multiple, or earnings fell so the multiple rose on its own. The stock price reflects the market's assessment of the company's future; the P/E only tells you how large that price is relative to the earnings already reported. That is why the multiple can rise while earnings fall, and why a rising P/E does not, by itself, mean the market turned more optimistic.
But not always. A rising multiple on falling earnings is a bet on recovery, not proof of one. When the recovery never arrives, the multiple contracts and both terms fall together, so the stock drops harder than the earnings alone would suggest.
When a P/E rises while earnings fall, first ask whether the price actually rose. If it did, the market may be looking beyond the current earnings number; if it did not, the multiple may have risen only because the denominator shrank. In either case, the real question is whether the future implied by the valuation actually arrives.
The small numbers in the text mark the claims this story leans on. Here is where each one comes from, and how solid it is.
- 1FY20 and FY21 EPS of about ₹32.5 and ₹26.2 are from Screener.in, a roughly 19% year-on-year fall. The company's own quarterly commentary attributed the weakness to the COVID lockdown (plants suspended from 26 March 2020, resumed 20 April 2020) and softer demand.
- 2FY22 and FY23 EPS of about ₹33.7 and ₹40.8 are from Screener.in, showing earnings recovered past the pre-COVID level within two years.
- 3BLS International: FY21 EPS of about ₹1.22 and FY26 EPS of ₹16.68 are from Screener.in, a roughly 69% five-year compounded growth, against a stock CAGR of about 48% over the same period, so the P/E compressed as earnings grew. The MEA debarment (9 October 2025) and its reversal by the Delhi High Court (18 December 2025) are documented in the BLS company report on this site. The listed reasons for the multi-year de-rating are candidate explanations, not established causes.